in

data visualization : The rise of technology companies in the last 20 years

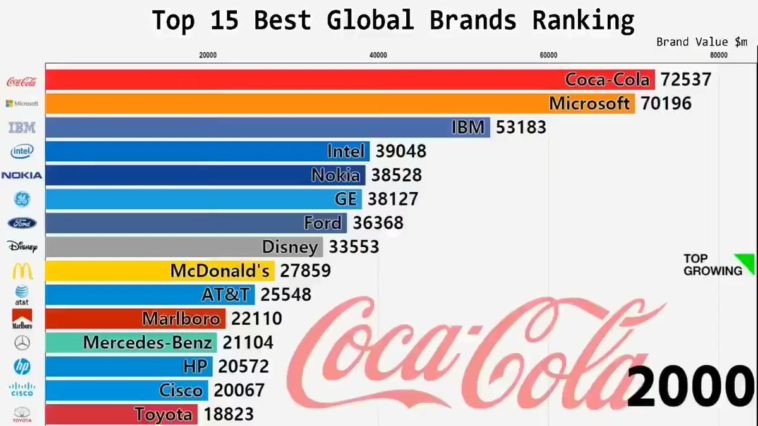
Data visualization : The rise of technology companies in the last 20 years

The rise of technology companies in the last 20 years

By PZinger6

At infographic.tv we provide handpicked collection of the best infographics and data charts from around the world.

  • Don’t forget to share the love !
  • What do you think?

    459 points
    Upvote Downvote

    Leave a Reply

    Your email address will not be published. Required fields are marked *

    Loading…

    Map : The Muslim percentage of the total population in the Soviet Union in 1979 [1035 × 1238].

    Map : High detailed map of Asian Turkey in 1895