Data visualization : The sources of pm 2.5 air pollution in a typical semi-urban environment compared to a summer day in California [OC]
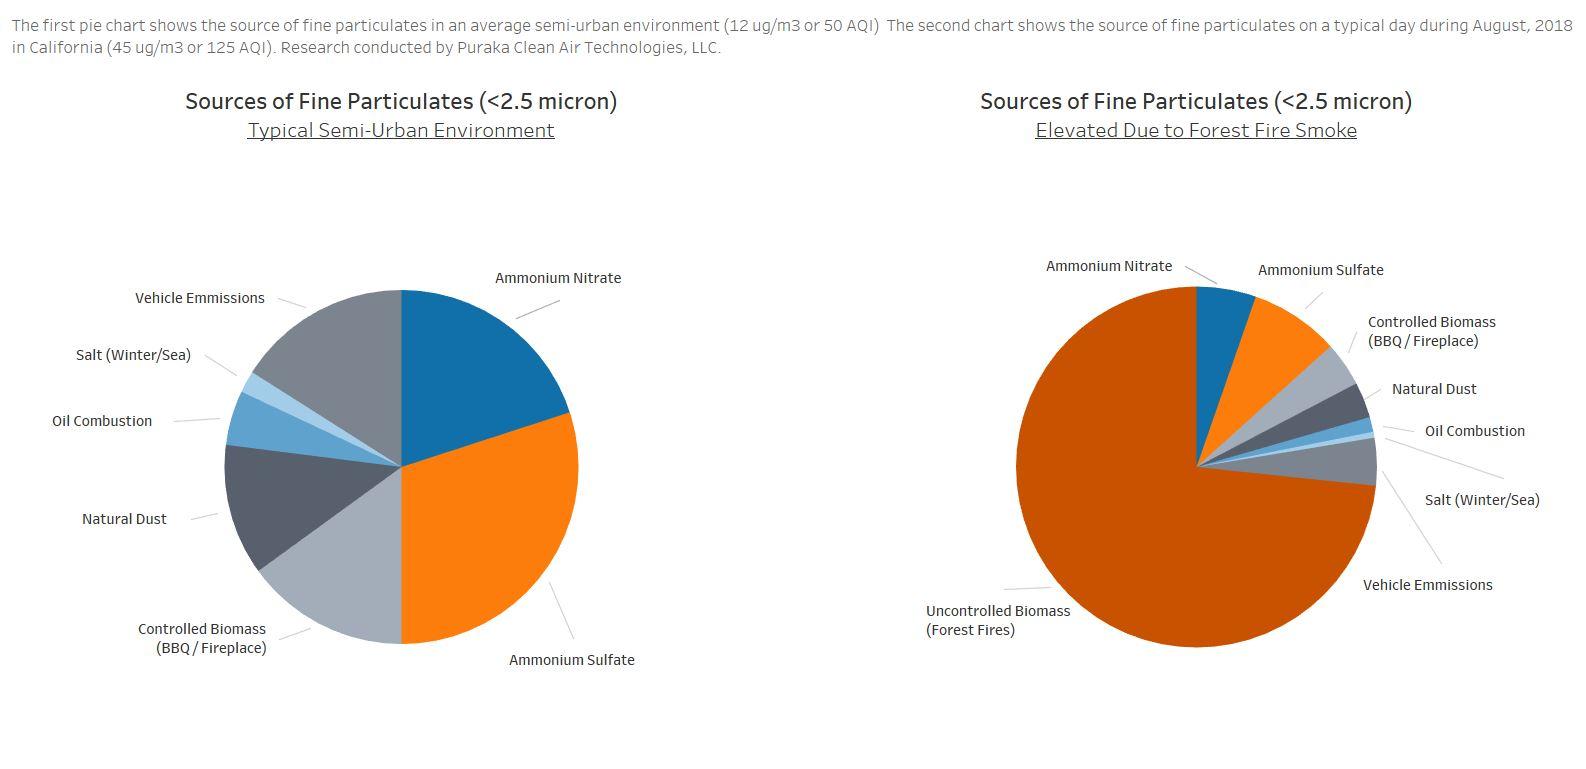
The sources of pm 2.5 air pollution in a typical semi-urban environment compared to a summer day in California [OC]
By classicalnemesis
At infographic.tv we provide handpicked collection of the best infographics and data charts from around the world.