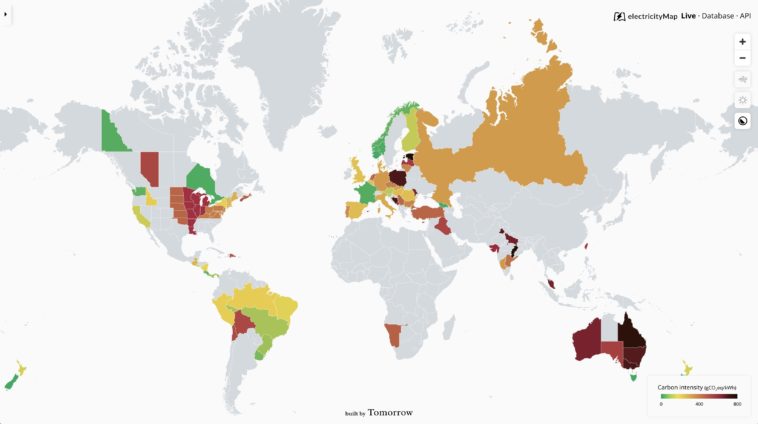
Data visualization : World wide live electricity production/consumption map by source and cross-border trade
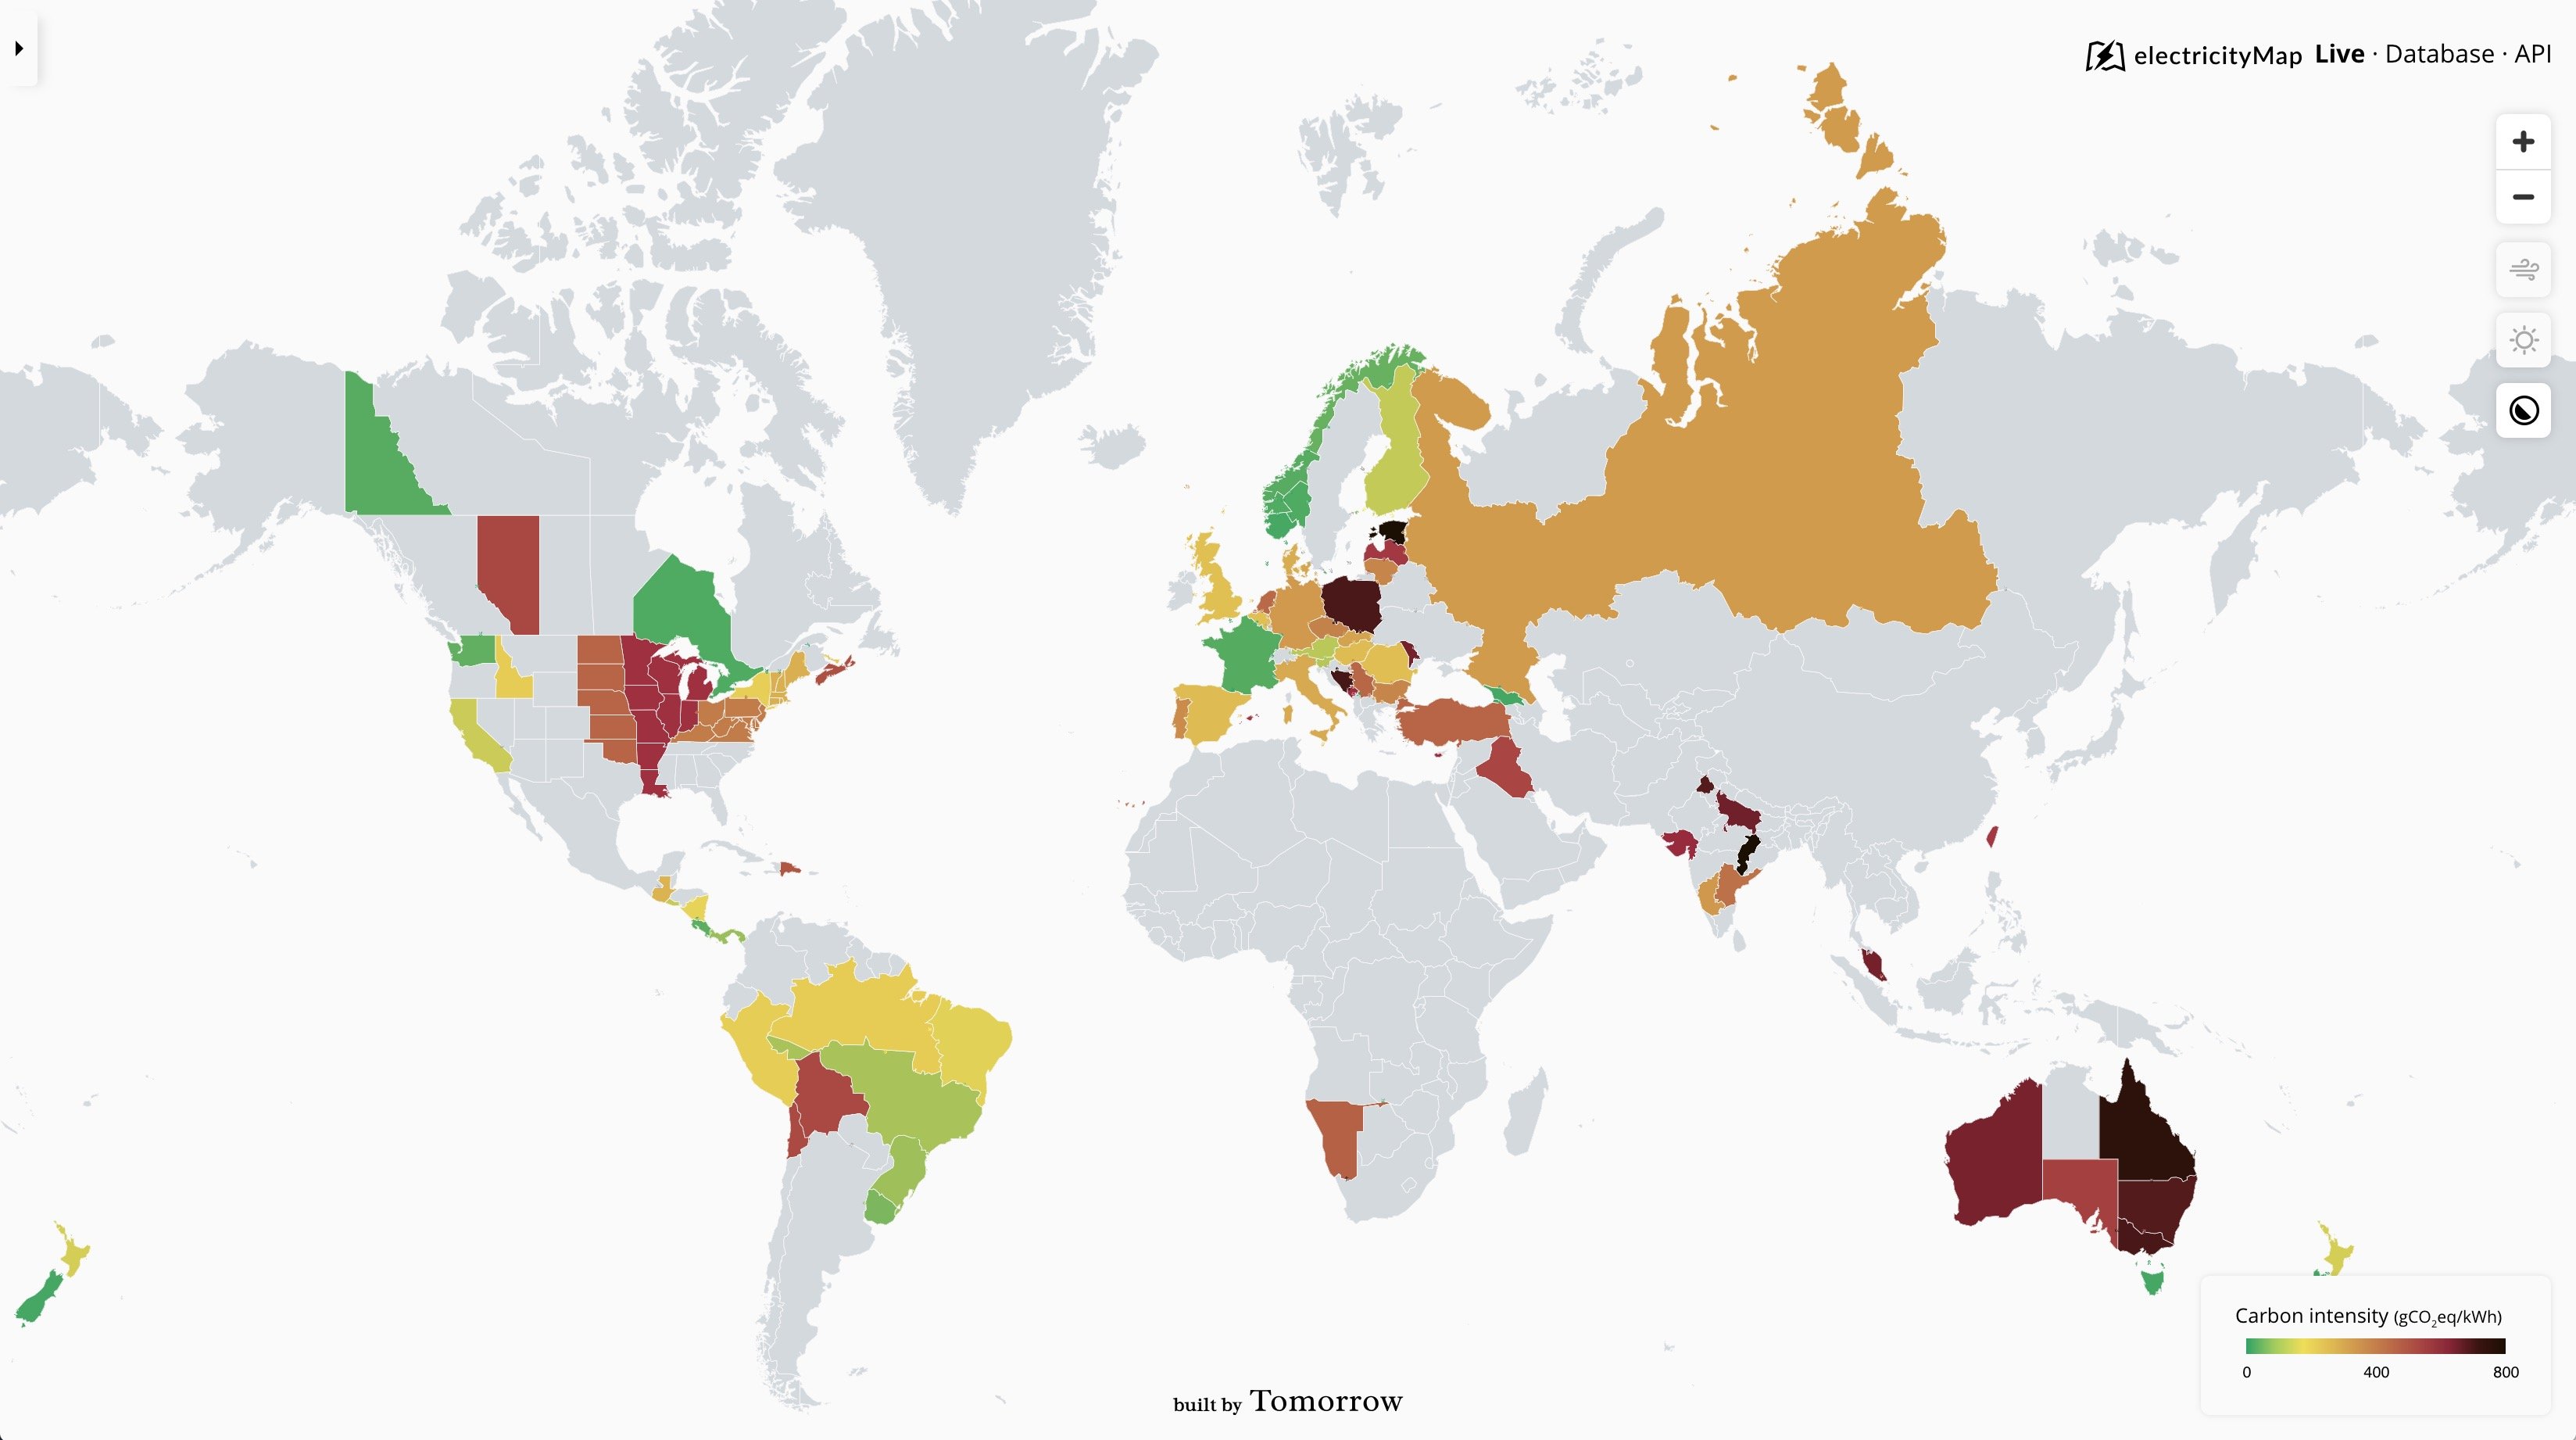
World wide live electricity production/consumption map by source and cross-border trade
By MightyH20
At infographic.tv we provide handpicked collection of the best infographics and data charts from around the world.