Data visualization : Yesterday as I was reading an UMAP paper, I saw that: Visualization of 30,000,000 integers as represented by binary vectors of prime divisibility, colored by density of points
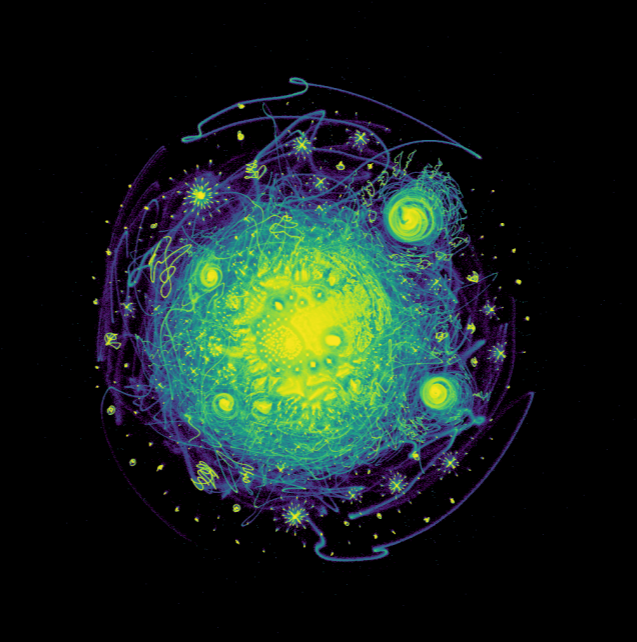
Yesterday as I was reading an UMAP paper, I saw that: Visualization of 30,000,000 integers as represented by binary vectors of prime divisibility, colored by density of points
By NightmareOx
At infographic.tv we provide handpicked collection of the best infographics and data charts from around the world.