Infographic : Series of infographics realised for the Energy Transition…
![]()
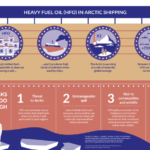
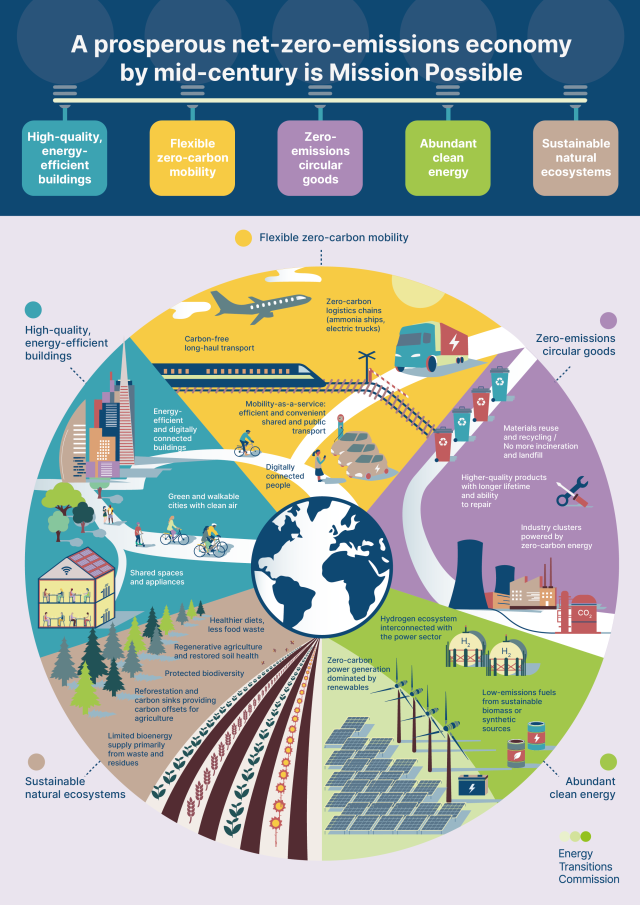
Series of infographics realised for the Energy Transition Commission, to accompany their report “Making Mission Possible”. The graphics visualise
why a net-zero global economy is technically and economically possible by 2050 and the profound transformation of the global energy system it will require.