Infographic : Chartmaker milestone! 1000 references – Visualising Data
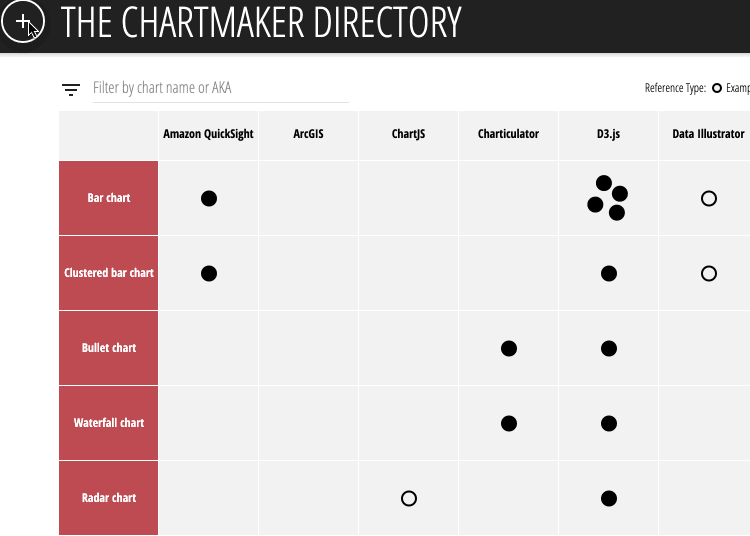
It is just over 2 years since I launched the Chartmaker Directory, an open resource to help people navigate through guidance on what charts can be made in which tools, and how. I’m delighted to note that we have just reached the milestone of 1000 references!
Thanks to the community of helpful contributors out there, the directory’s contents have grown steadily during this time to help us reach this stage. That does not mean we’ve reached the end, though! There are still glaring empty cells underneath many of the hand-picked visualisation tools, applications and libraries that currently lack links to published references.
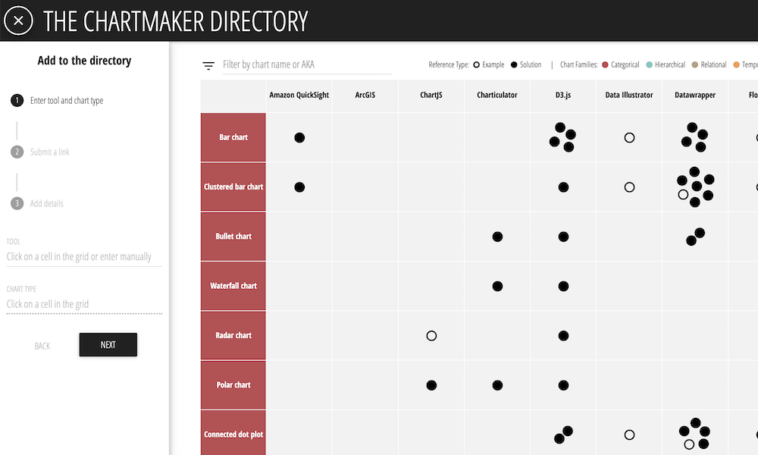
As a reminder, references are either examples or solutions: examples provide links to evidence of a tool being capable of making a particular chart type; solutions provide links to solutions that enable others to make a particular chart type.
If you have knowledge of a tool included in this directory, and know that tool is capable of creating a chart listed down the side of the matrix, please consider quickly adding a reference by clicking on the + sign in the top left corner (desktop only) and entering the short, simple details.