Infographic : Explore Explain S1 E1: Maarten Lambrechts
I’m delighted to launch the first season of Explore Explain, a video and podcast series about data visualisation design.
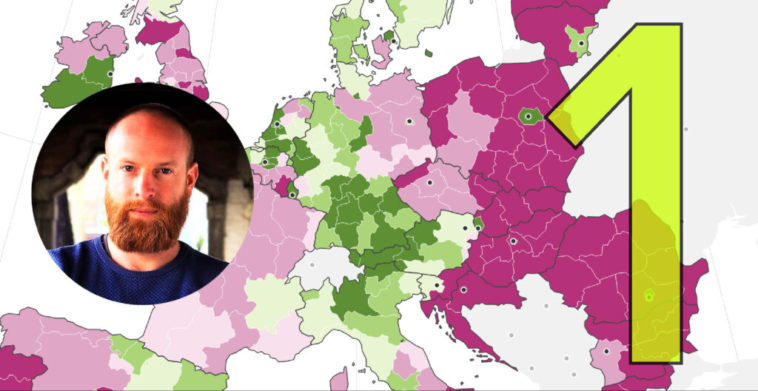
For this first episode it was a pleasure to welcome Maarten Lambrechts. We had a detailed conversation about his work on the project “Why Budapest, Warsaw, and Lithuania split themselves in two”, published on The Pudding website in April 2019.
To find out more information about how to listen, view and subscribe to the audio and video versions of this episode, visit the podcast page.
Audio Conversation
Video Conversation
You can watch this episode on the Explore Explain Youtube channel or through using the embedded player below.
Here are further links to some of the key resources mentioned during this episode:
- Maarten’s project write-up
- The Pudding
- The Pudding ‘Pitch as Story’
- Eurostat visualisation that influenced Maarten’s thinking
- D3.js
- The Pudding’s scrollytelling boilerplate
- Flubber
- Tools for Eurostat Open Data – R Eurostat package
- ColorBrewer