Infographic : Explore Explain S1 E2: Dr Cath Sleeman
I’m delighted to launch the first season of Explore Explain, a video and podcast series about data visualisation design.
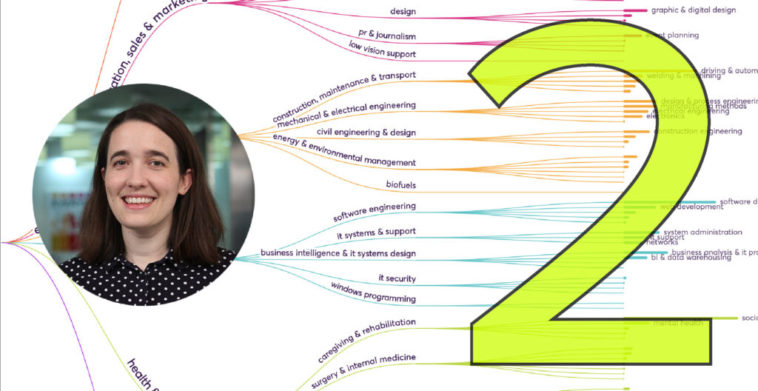
For this second episode it was a pleasure to welcome Dr Cath Sleeman. We had a detailed conversation about her work on the project “Making sense of skills: A UK skills taxonomy”, published on the Nesta website in 2018.
To find out more information about how to listen, view and subscribe to the audio and video versions of this episode, visit the podcast page.
Video Conversation
You can watch this episode on the Explore Explain Youtube channel or through using the embedded player below.
Audio Conversation
Audio podcasts will soon be published across all common platforms, which means you will be able to search for and find this series to subscribe to directly. As of 5th May, not all platforms have yet approved the podcast for inclusion in their directories – we are awaiting Apple, TuneIn and Stitcher – but this should be completed in the next week.
Until then, you can directly reach the podcast on ANY platform by manually adding this url – https://feed.pod.co/exploreexplain – or by clicking this link if you’re reading this on a phone browser.
Here are further links to some of the key resources mentioned during this episode: