Infographic : Simplified slope graphs – Visualising Data
As somebody who tries to consume as much visualisation work as possible, I always get a little extra joy from seeing clusters of the same techniques emerging. One such recent trend has been the use of simplified slope graphs.
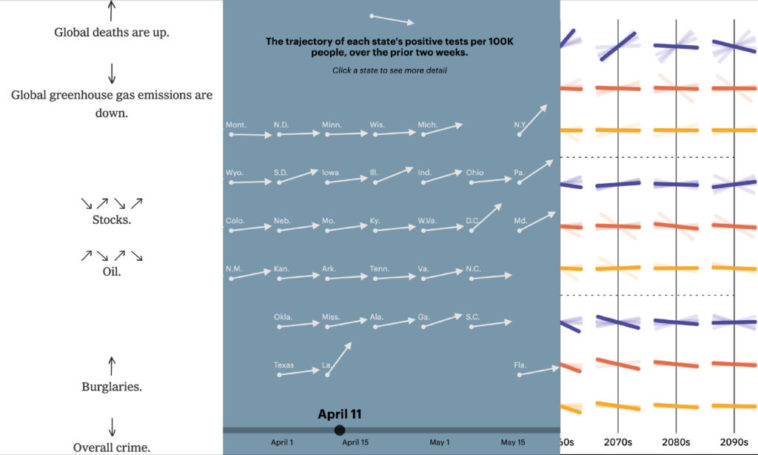
By ‘simplified’ I mean they are stripped right back to a simple function of just showing the direction of change between two points in time, there are no axes and no other chart apparatus, just the trends.
Here are three recent pieces I’ve seen demonstrate this representation approach:
The SENSES Toolkit from the Urban Complexity Lab Potsdam, looking at uncertainty trends in fossil fuels volumes.
The Coronavirus dashboard from ProPublica, showing trends for coronavirus cases across each US State.
The ’54 Ways Coronavirus Has Changed Our World’ article in the New York Times, by Larry Buchanan