Infographic : Statewide Texas Car Accident Statistics Infographic
There is so much content now online that becoming more and more niche is a far better focus than wide-reaching subjects. Niche content benefits users who are looking for highly specific information and it benefits publishers and content producers who can laser focus on a subject and not spread their efforts too thinly.
Localised/regional content offers value and local statistics and data are always of great use to businesses and individuals living in an area.
On first glance, car accident statistics may seem rather grim but sociologically it is a valuable metric that can offer insights into how behaviours can be changed. Or even, how safer driving campaigns can be introduced.
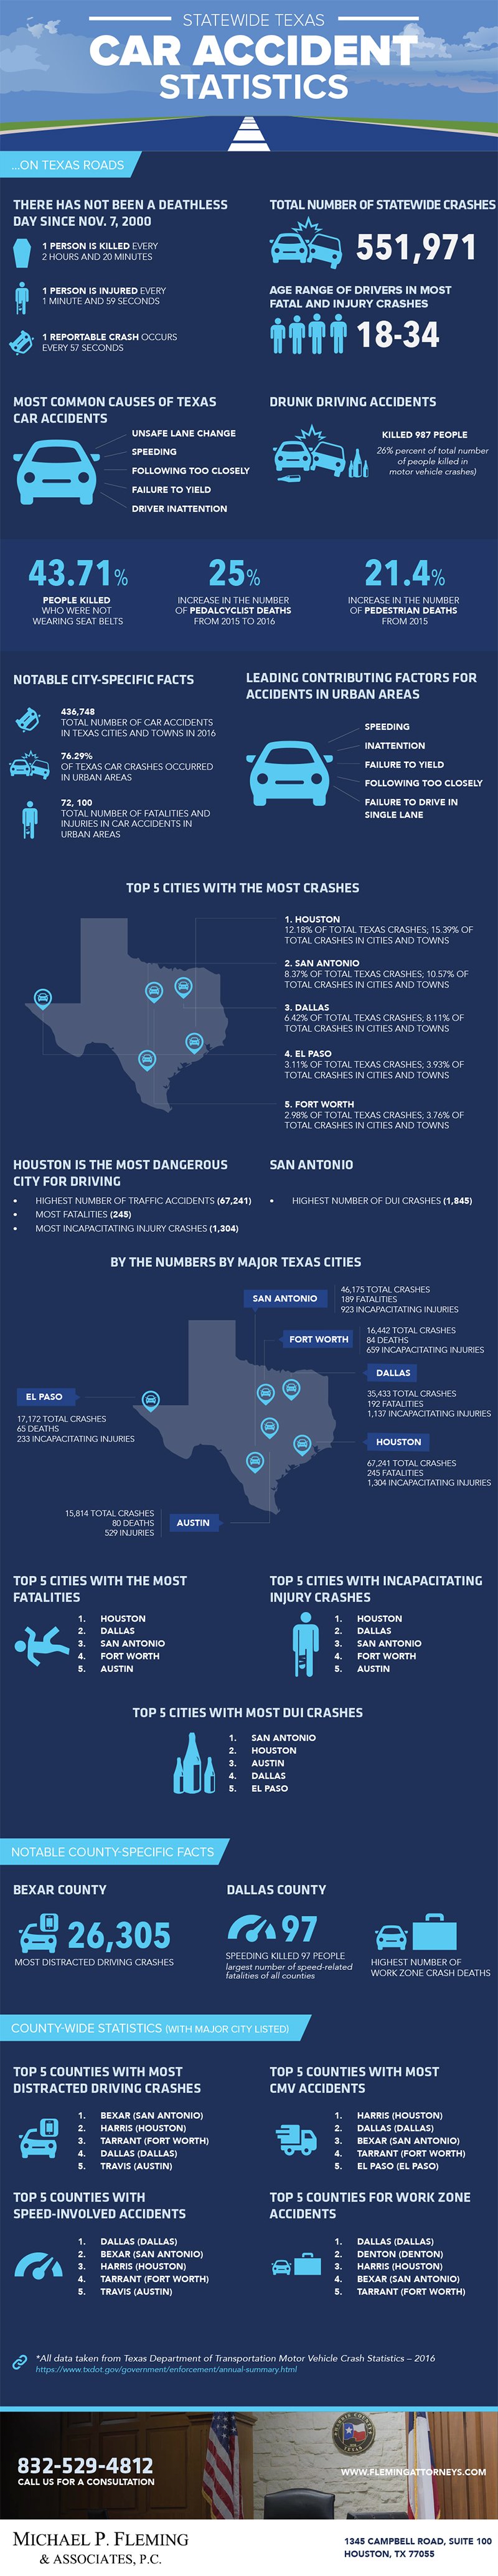
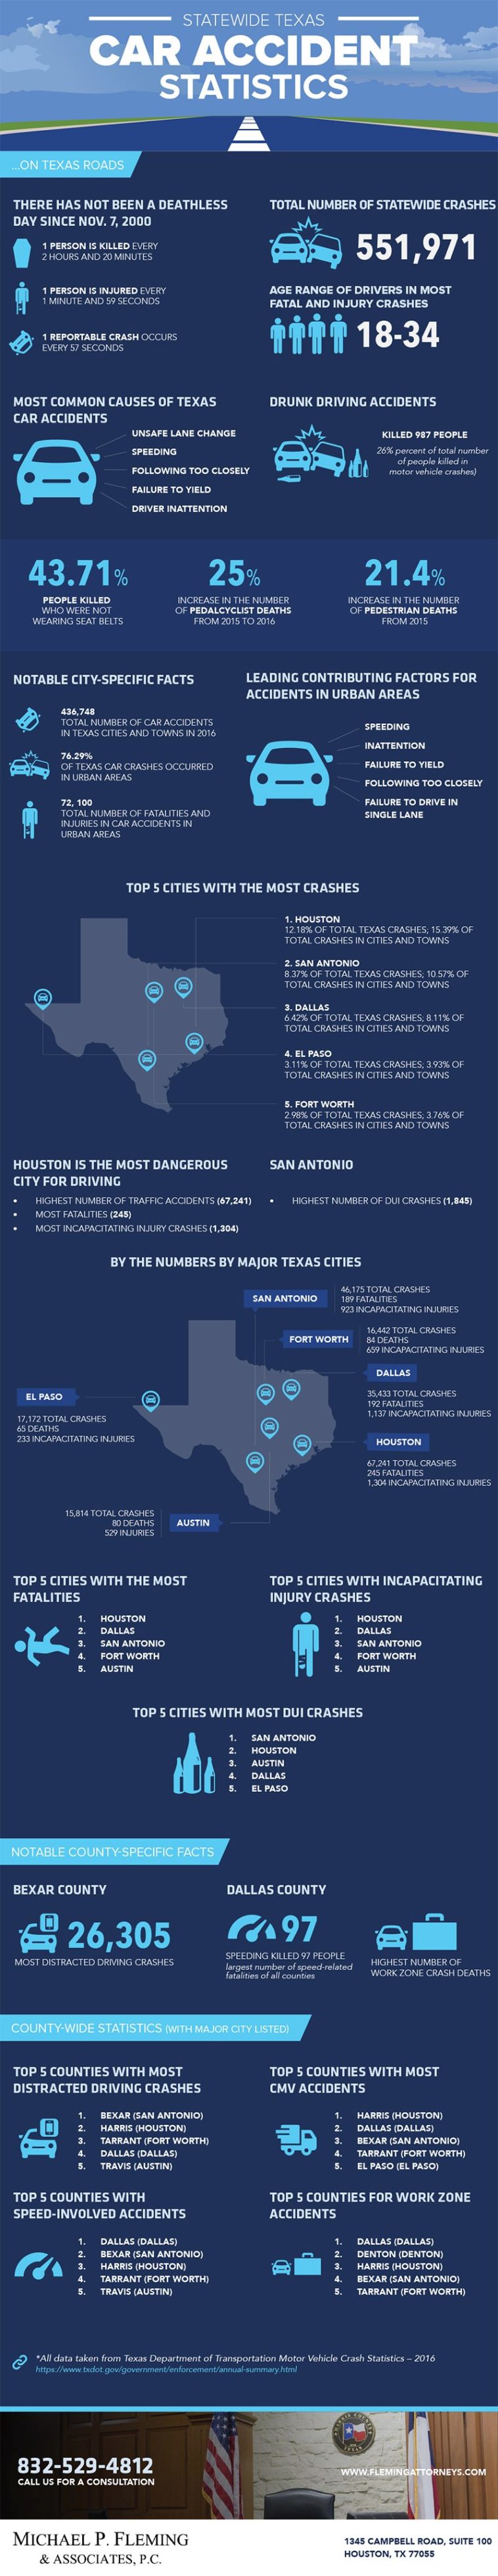
It is shocking that since 2000 not a day has gone by that a person wasn’t killed in a car accident in Texas. There is a reportable accident every 57 seconds. C’mon Texas, what are you doing?
Statewide Texas Car Accident Statistics infographic offers a selection of statistics about the state of driving and car accidents in Texas and proves to be shocking and compulsive reading.
Design overall – 7
The graphic uses a landscape banner that draws the eye into the piece towards the headline through the use of perspective. The colour palette is kept to a minimal two shades of blue and white that assists in the eye consuming the volume of information contained.
Typography – 7
Type hierachy is clear and all information is easy to read.
Illustration – 7
Basic graphic icons illustrate the data without any overt frills that lends to the crisp graphic design that makes it easy to consume.
Content – 8
As said above, the content is compelling in its shocking nature and there is a vast range of data presented.
Overall score – 7.25
An infographic with a highly niche subject that offers strong content from Fleming Attorneys.