Infographic : The More The Merrier: Holiday Hiring Infographic
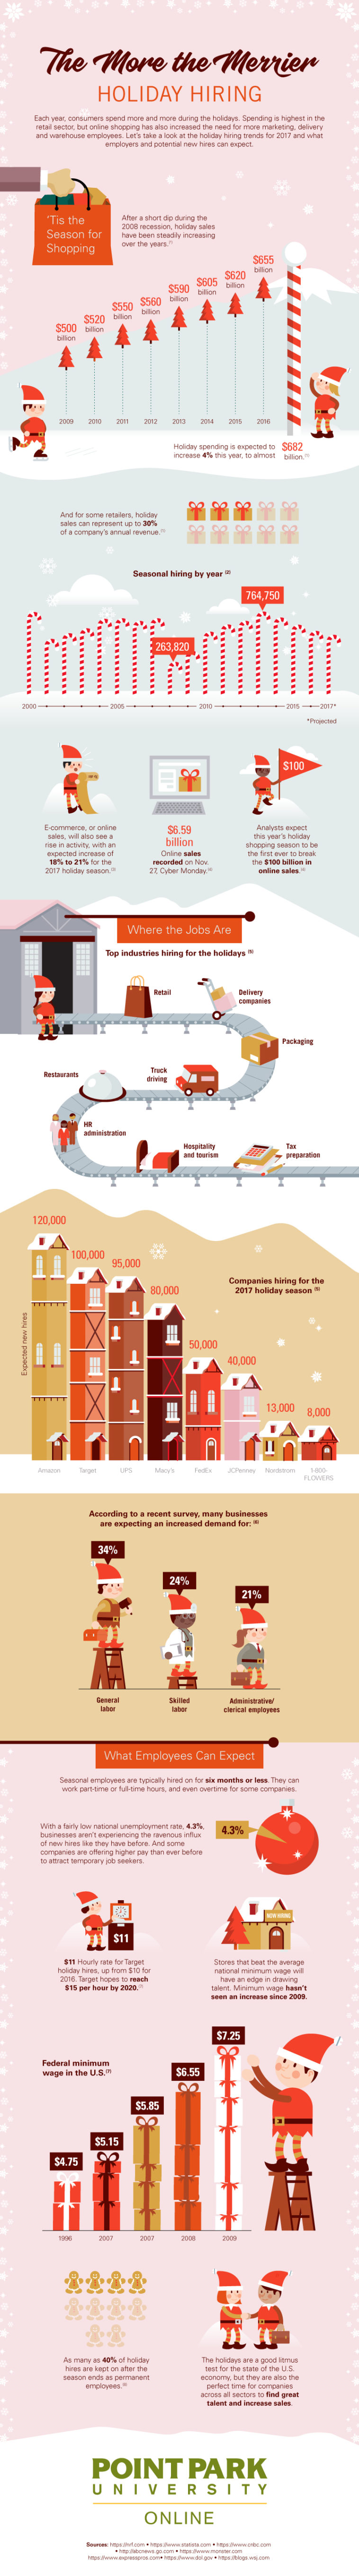
Historically, the holiday season at Christmas is one of the busiest times of the year for retail with many businesses taking up to 30% of their shopping revenue in a few short weeks.
In 2009 total holiday sales spend was at $500 billion and 2018 is expecting a 4% growth on the previous year to $682 billion.
Online shopping has grown exponentially over the last few years with massive year-on-year growth. Cyber Monday in 2017 reached a peak of $6.59 billion for recorded online sales.
All this spending is good for the economy and this filters down to mean more employment for the workforce infrastructure that supports the stores.
The More The Merrier: Holiday Hiring infographic delivers a wealth of stats about holiday shopping and hiring. Point Park University has directed this to their MBA students.
Design overall – 9
A very pleasing infographic that uses strong illustration to reflect the holiday season theme. Each section is clearly divided with use of backgrounds and all stats are well-rendered with seasonal style pictoral graphs.
Typography – 7.5
The typography is clear to read and delivers the information in a clean way without overwhelming the design.
Illustration – 8.5
The use of strong illustration makes a fun and engaging infographic about the subject and avoids being visually overwhelming with good use of space and layout.
Content – 8.5
The content is stuffed full of stats and data and delivers a wealth of information relevant to their intended audience of MBA students.
Overall score – 8.5
An excellent infographic, with strong content and a pleasing design.