Infographic : visualcomplexity.com | Visualizing Topic Models
 |
 |
| The materials shown on this page are copyright protected by their authors and/or respective institutions. |
|
Visualizing Topic Models |
|
| Author(s): Ted Underwood |
|
| Institution: (unknown) |
|
| Year: 2012 |
|
| URL: http://tedunderwood.com/2012/11/11/visualizing-topic-models/ |
|
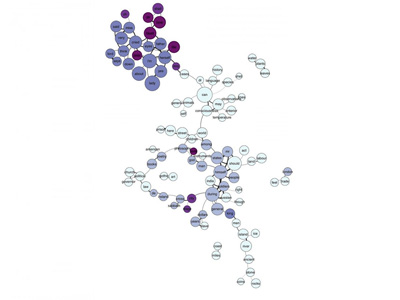
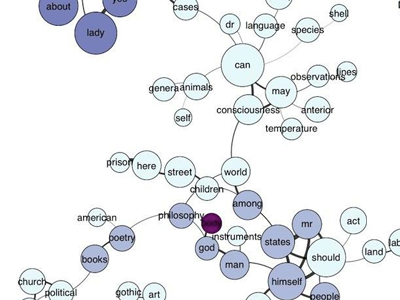
| Project Description: Ted Underwood, working with Michael Simeone, developed strategies for visualizing topic models. Most methods for computing topic models have ontologically fuzzy boundaries, and so focusing on a single topic is risky. Underwood produced a correlation matrix of the topics and connected topics in this graph that are strongly correlated with each other. Size is logarithmically proportional to to the number of tokens. Even this kind of network model, however, suggests visual structure that isn’t necessarily there. Underwood goes further to suggest the use of PCA to visualize the relationship between topics. |
|
|
|
|
|
|
|
|
Comments (0): |
|
| *Note* Before you submit your comment, bear in mind there’s no guarantee it will be seen by this project’s author. In case you want to contact the author directly, please follow the provided URL. | |
| Leave a Comment: | |
|
* COMMENTS HAVE BEEN TEMPORARILY DISABLED * (We’re looking for the best solution to avoid unwanted SPAM) |
|