Infographic : Visualisation resources catalogue updated – Visualising Data
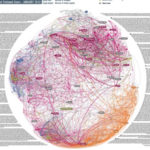
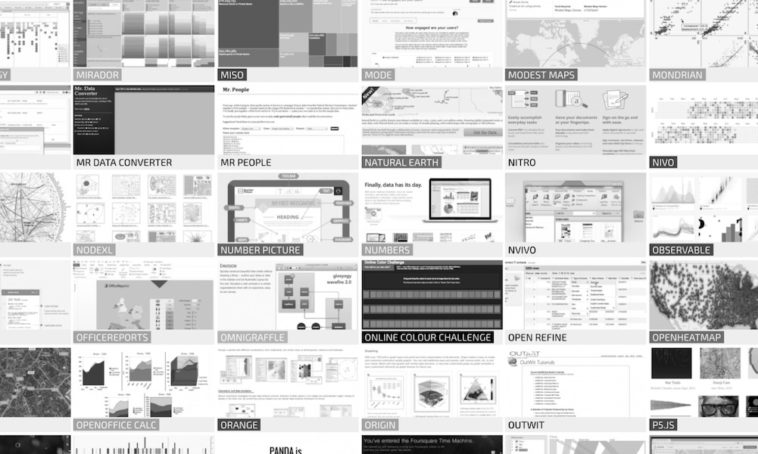
The range of data visualisation applications, tools and libraries continues to grow and to reflect the recent additions to this field I have updated my data visualisation resources collection. There are now 352 items in this directory organised generally across the 8 groupings:
- Data Handling – options to help gather, prepare, and analyse data
- Applications – desktop applications for creating charts
- Programming – programming languages and libraries
- Web-based – browser-based tools for creating charts
- Qualitative – tools focusing more on qualitative analysis
- Mapping – resources to enable spatial analysis and thematic mapping
- Specialist – broader resources to assist with the design workflow
- Colour – specific references for helping with colour decisions
I am particularly keen to remove any listed items that have become obsolete or update expired links, please let me know if you spot any.