Map Info & Chart : An animation showing earthquakes between 1901-2000 colour coded by depth and sized by magnitude. Source: NOAA Science on a Sphere
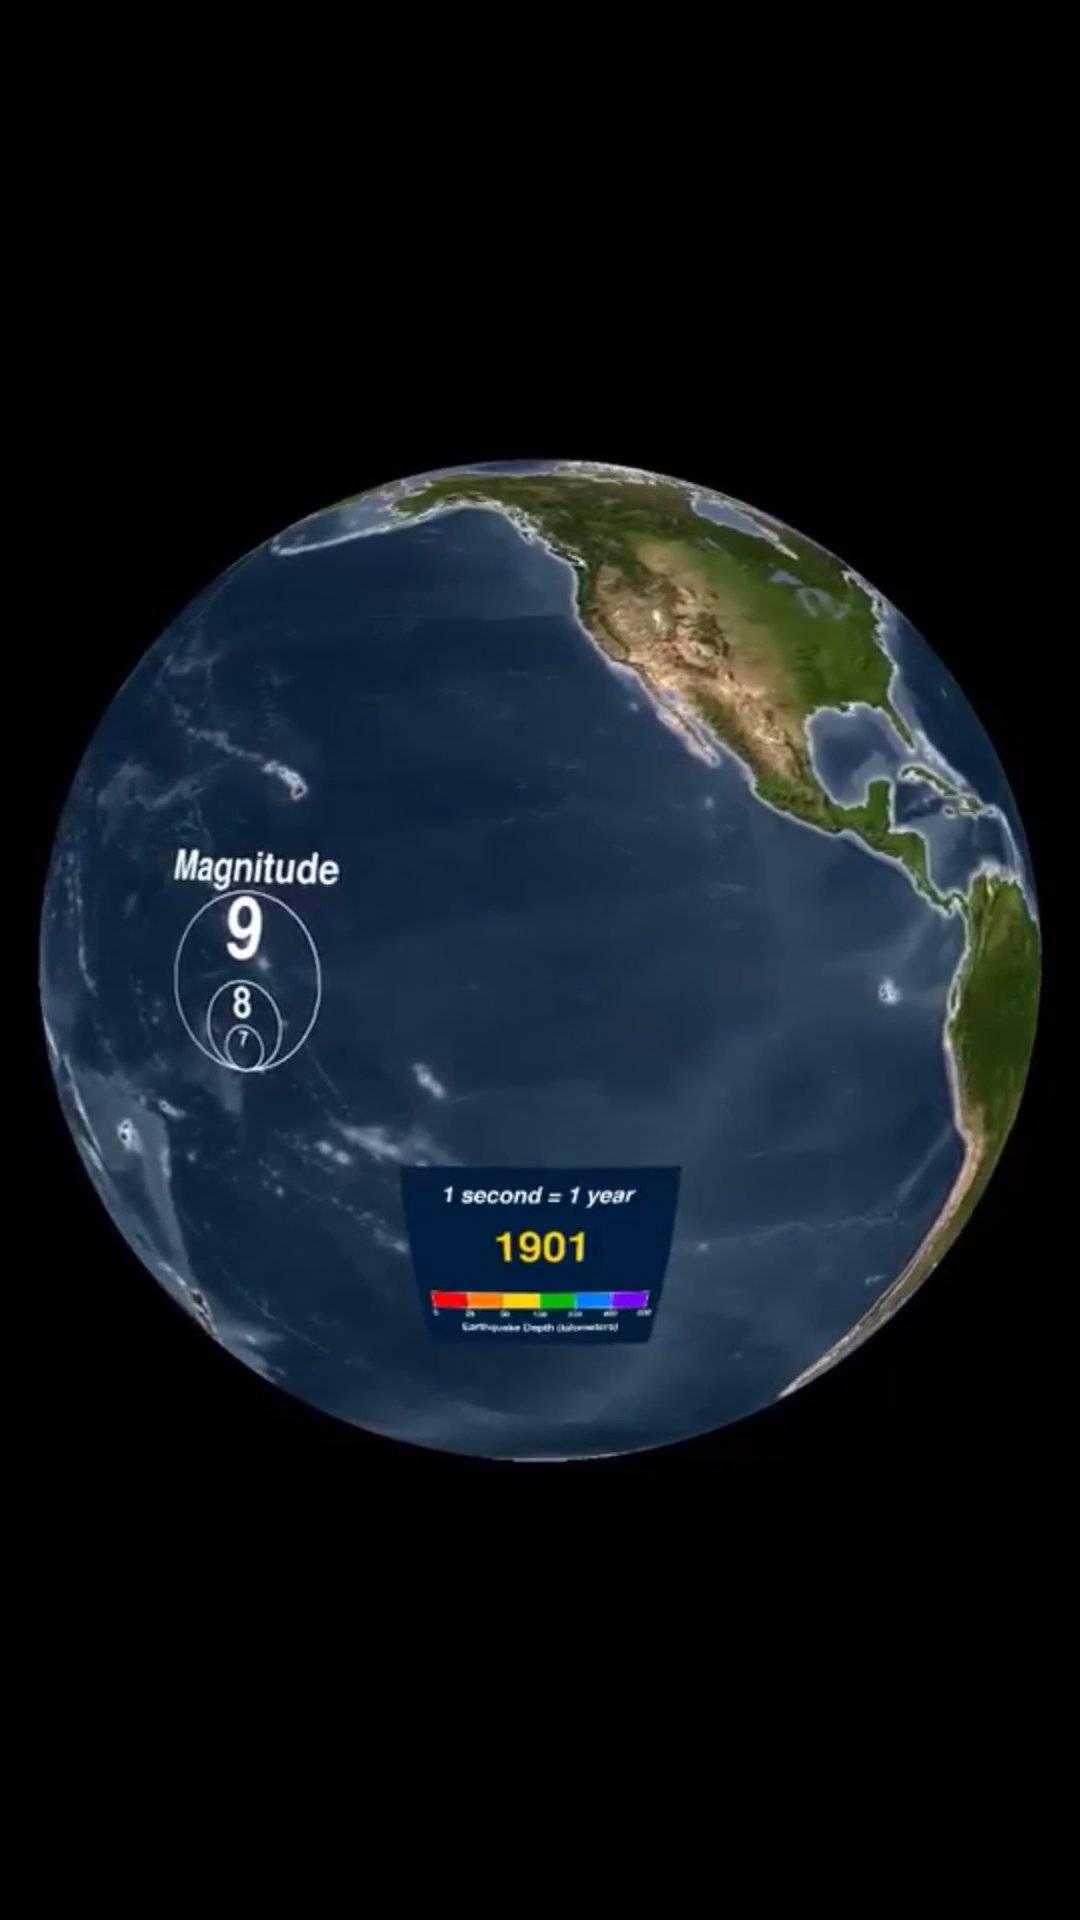
An animation showing earthquakes between 1901-2000 colour coded by depth and sized by magnitude. Source: NOAA Science on a Sphere
By boagslives
At infographic.tv we provide handpicked collection of the best infographics and data charts from around the world.