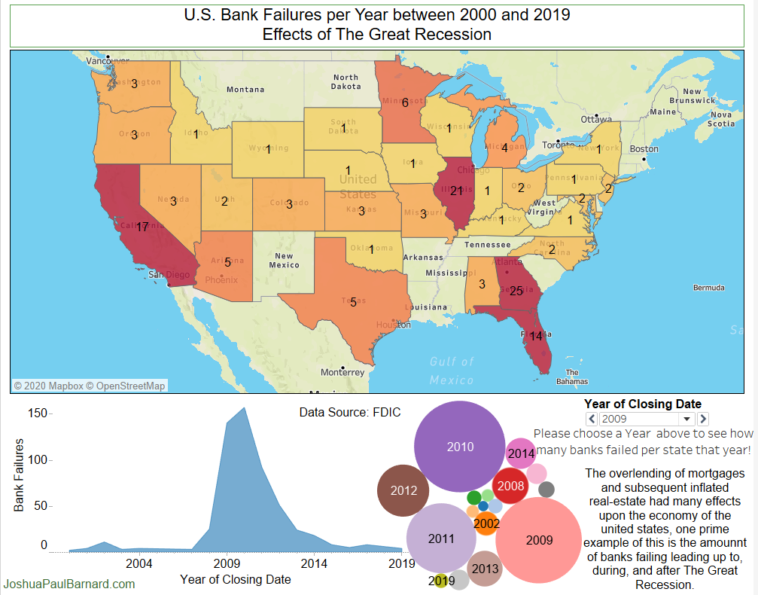
Map Info & Chart : Bank Failures per State for each individual Year from 2000 to 2019.
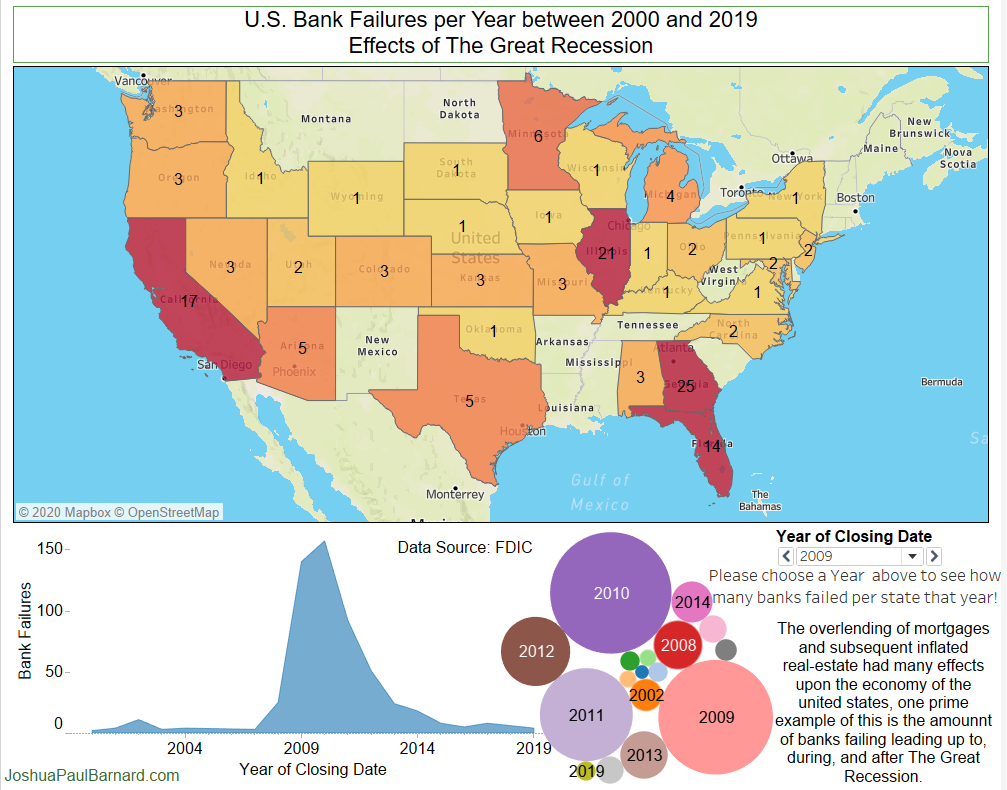
Bank Failures per State for each individual Year from 2000 to 2019.
By JoshuaPaulBarnard
At infographic.tv we provide handpicked collection of the best infographics and data charts from around the world.