Map Info & Chart : Did a regional design project last year about Northern Ontario. I was looking water systems affected by chemical releases from mining and how that’s been affecting indigenous communities in the area. The white circles are water advisories and the brown are affected water bodies.
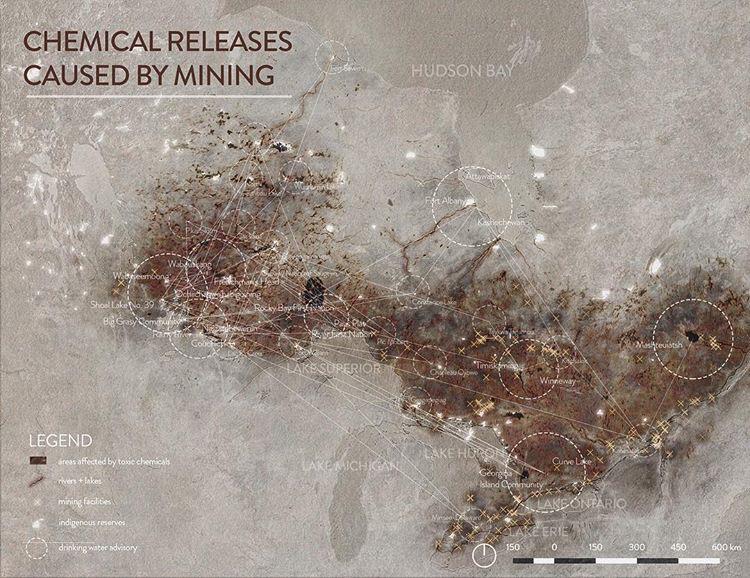
Did a regional design project last year about Northern Ontario. I was looking water systems affected by chemical releases from mining and how that’s been affecting indigenous communities in the area. The white circles are water advisories and the brown are affected water bodies.
By carl2882
At infographic.tv we provide handpicked collection of the best infographics and data charts from around the world.