in

Map : European subdivisions by GDP (PPP) Per capita according to IMF data 2018

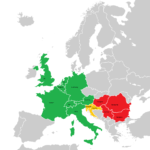
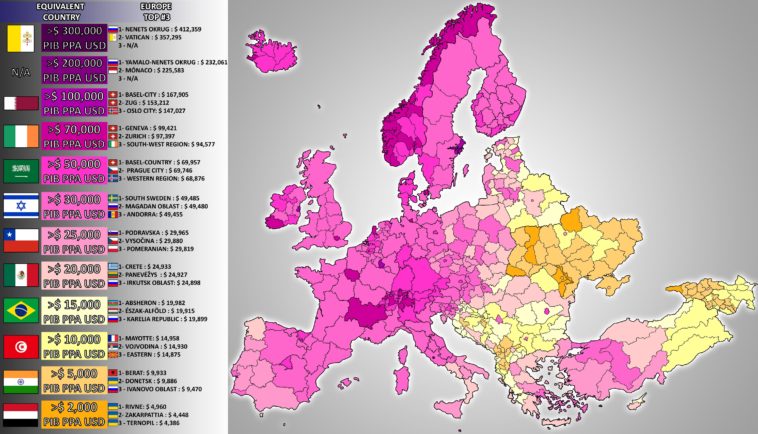
Map Info & Chart : European subdivisions by GDP (PPP) Per capita according to IMF data 2018

European subdivisions by GDP (PPP) Per capita according to IMF data 2018

By Tanatos24

At infographic.tv we provide handpicked collection of the best infographics and data charts from around the world.

  • Sharing is caring !
  • What do you think?

    457 points
    Upvote Downvote

    Leave a Reply

    Your email address will not be published. Required fields are marked *

    Loading…

    Map : Corruption in Europe by Police. Green not witnessed, red witnessed. yellow likely both but don’t remember exactly.

    Map : Dawn of humans [2400×1560]