Video Infographic : 40 Best Infographic Design Ideas to Jumpstart your Creativity – Learn Infographic Design Tutorial
Video
Description
In this Video, Mike from Visme is back to show you various infographic types and why infographics are one of the best marketing tools out there. In fact, studies have shown that including visuals makes information easier to remember, and your messages are received quicker than through text alone. It’s not surprising that infographics have extended far beyond the marketing sphere to arenas such as teaching and the media.
Many are undoubtedly anxious to create amazing infographics, but might not know where to start. What ideas are powerful? Creative? What resonates with your audience?
First, you should probably know the main types of infographics. Visme recently created a free visual beginner’s guide which illustrates several types of infographics, those being:
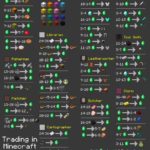
1- A mixed-chart infographic includes a variety of different charts to show data.
2- A list is mostly text that lists information about a given subject.
3- A timeline looks at how a subject has changed over time.
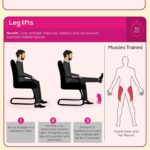
4- A how-to guide is a step-by-step guide to creating something.
5- A flowchart starts at a single point and branches off based on different decisions.
6- A comparison compares and contrasts two different subjects.
7- A location-based infographic uses a map to look at statistics across a wide range.
8- A photo-graphic uses mostly photographs, combined with text, to explain a point.
9- A hierarchical infographic stacks items or subjects based on a predefined level.
10- A single chart is a chart (such as a bar or line graph) that gives statistics on a subject.
11- Visualized numbers add images to statistics to make them more appealing.
12- An anatomical infographic breaks down what makes something work.
13- A visual resume is a resume in infographic form.
Want to learn more about infographic ideas? Read our
Sources: