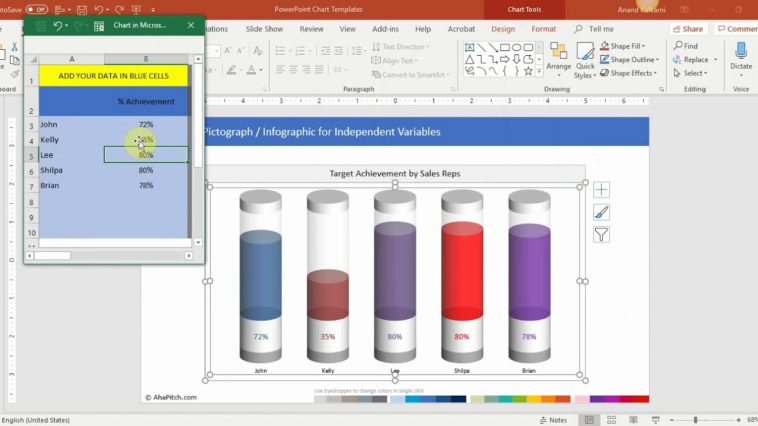
Video Infographic : Chart 48 | Tubes Fill Pictograph Infographic for Independent Variables
Video
Description
See all charts:
Use this engaging data driven column chart infographic / pictograph template to present data comparisons creatively with tubes fill effect.