in

Video Infographic : Chart 51 | Box Fill Pictograph Infographic​

Video Infographic : Chart 51 | Box Fill Pictograph Infographic​

Video

Description

See all charts:

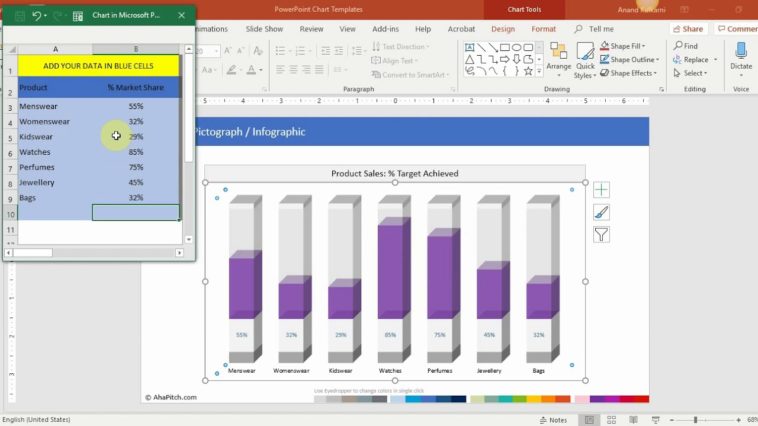
Use this engaging data driven column chart infographic / pictograph template to present data comparisons creatively with box fill effect.

  • Don’t forget to share this video with your friends !
  • What do you think?

    459 points
    Upvote Downvote

    Leave a Reply

    Your email address will not be published. Required fields are marked *

    Loading…

    Data Chart : How Instagram Dictates Fashion Trends [Infographic

    Visual : This deserves to be here