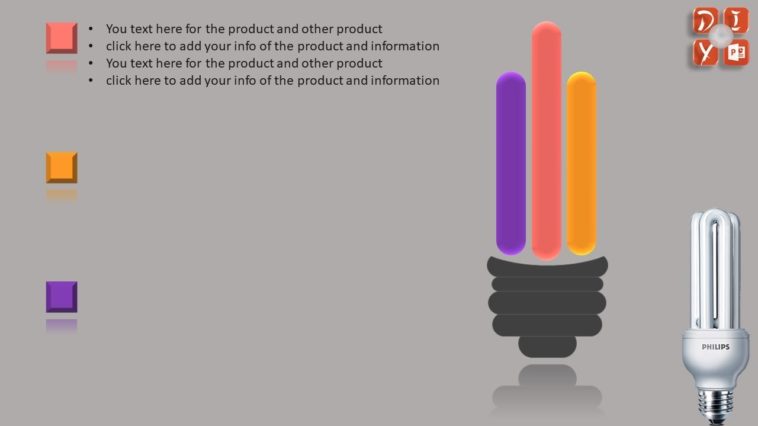
Video Infographic : Creative 3 Steps Energy saving lamp Infographic, PPT element graphic design, ppt design idea 061
Video
Description
Creative 3 progressive graphs relationship PPT design
Creative 3 stage PPT design
PPT element graphic PNG,jpg clipart.
free powerpoint template.
This video show how to Create 3 Steps CIRCULAR Infographic in PowerPoint Presentation.
How to Draw 3 Process Models in PowerPoint
PowerPoint shapes design ideas
PPT 设计创意
Learn to create filled Spheres infographics in PowerPoint with this tutorial.
Keywords:
business,finance,pie chart,percentage


Loading…