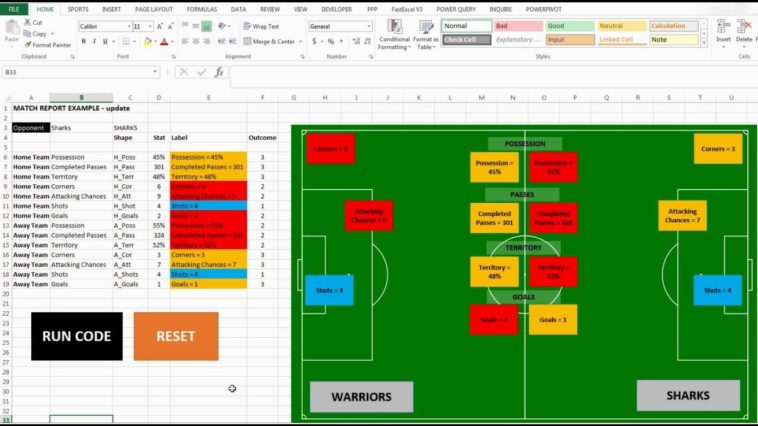
Video Infographic : EAF #81 – Use Excel VBA to make simple infographics
Video
Description
Vimeo Course Links
[Discount code: Track or TrackUSA]
[Discount code: Tricks or TricksUS]
[Discount code: ET4S or ET4SUSA]
Use VBA and formula to colour shapes and link text. You can then use these tools to create infographic style reports and make the data more interesting