in

Video Infographic : How to Create an Infographic with Canva – 1/23/17

Video Infographic : How to Create an Infographic with Canva – 1/23/17

Video

Description

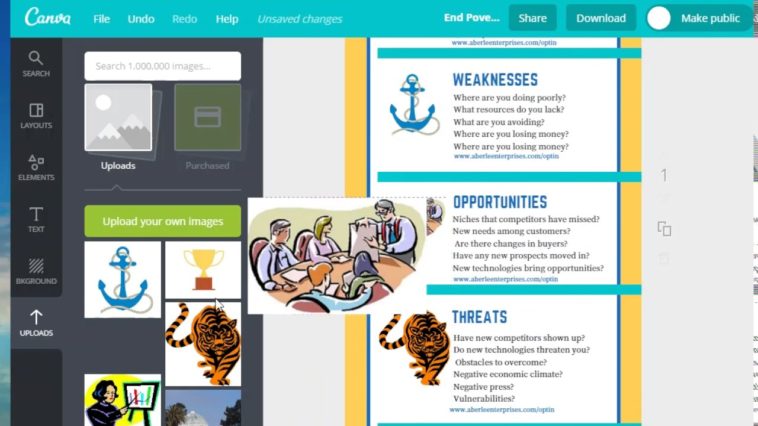
This video shows how to use one of the Canva Infographic samples to create a five bullet point infographic on SWOTT – Strengths, Weaknesses, Opportunities, Threats, and Trends. It included adding clip art images. To get notifications of articles and videos, go to This video is part of my Help Customers Buy channel.

  • Don’t forget to share this video with your friends !
  • What do you think?

    459 points
    Upvote Downvote

    Leave a Reply

    Your email address will not be published. Required fields are marked *

    Loading…

    Visual : Map of philosophical positions and their correlations among philosophers, based on Bourget & Chalmer’s survey [OC]

    data visualization : [OC] MonteCarlo Sampling of random 2D points from a 1×1 square into different shapes