Data visualization : Electricity used in my house in January 2019 compared to the inverse of the outside temperature [OC]
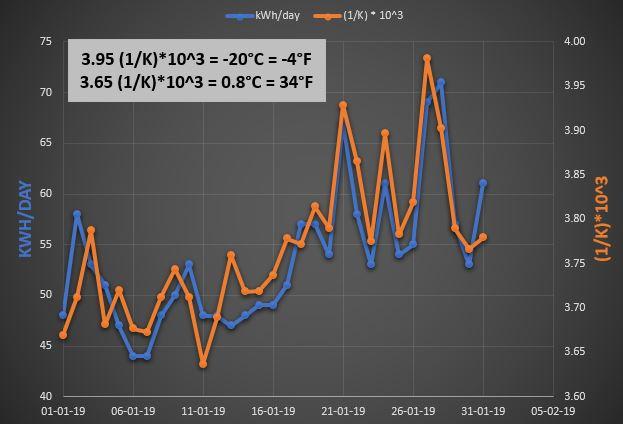
Electricity used in my house in January 2019 compared to the inverse of the outside temperature [OC]
By andersoonasd
At infographic.tv we provide handpicked collection of the best infographics and data charts from around the world.