Data visualization : [UPDATE] 3 months of Drinks per Night compared to Level of Happiness [OC]
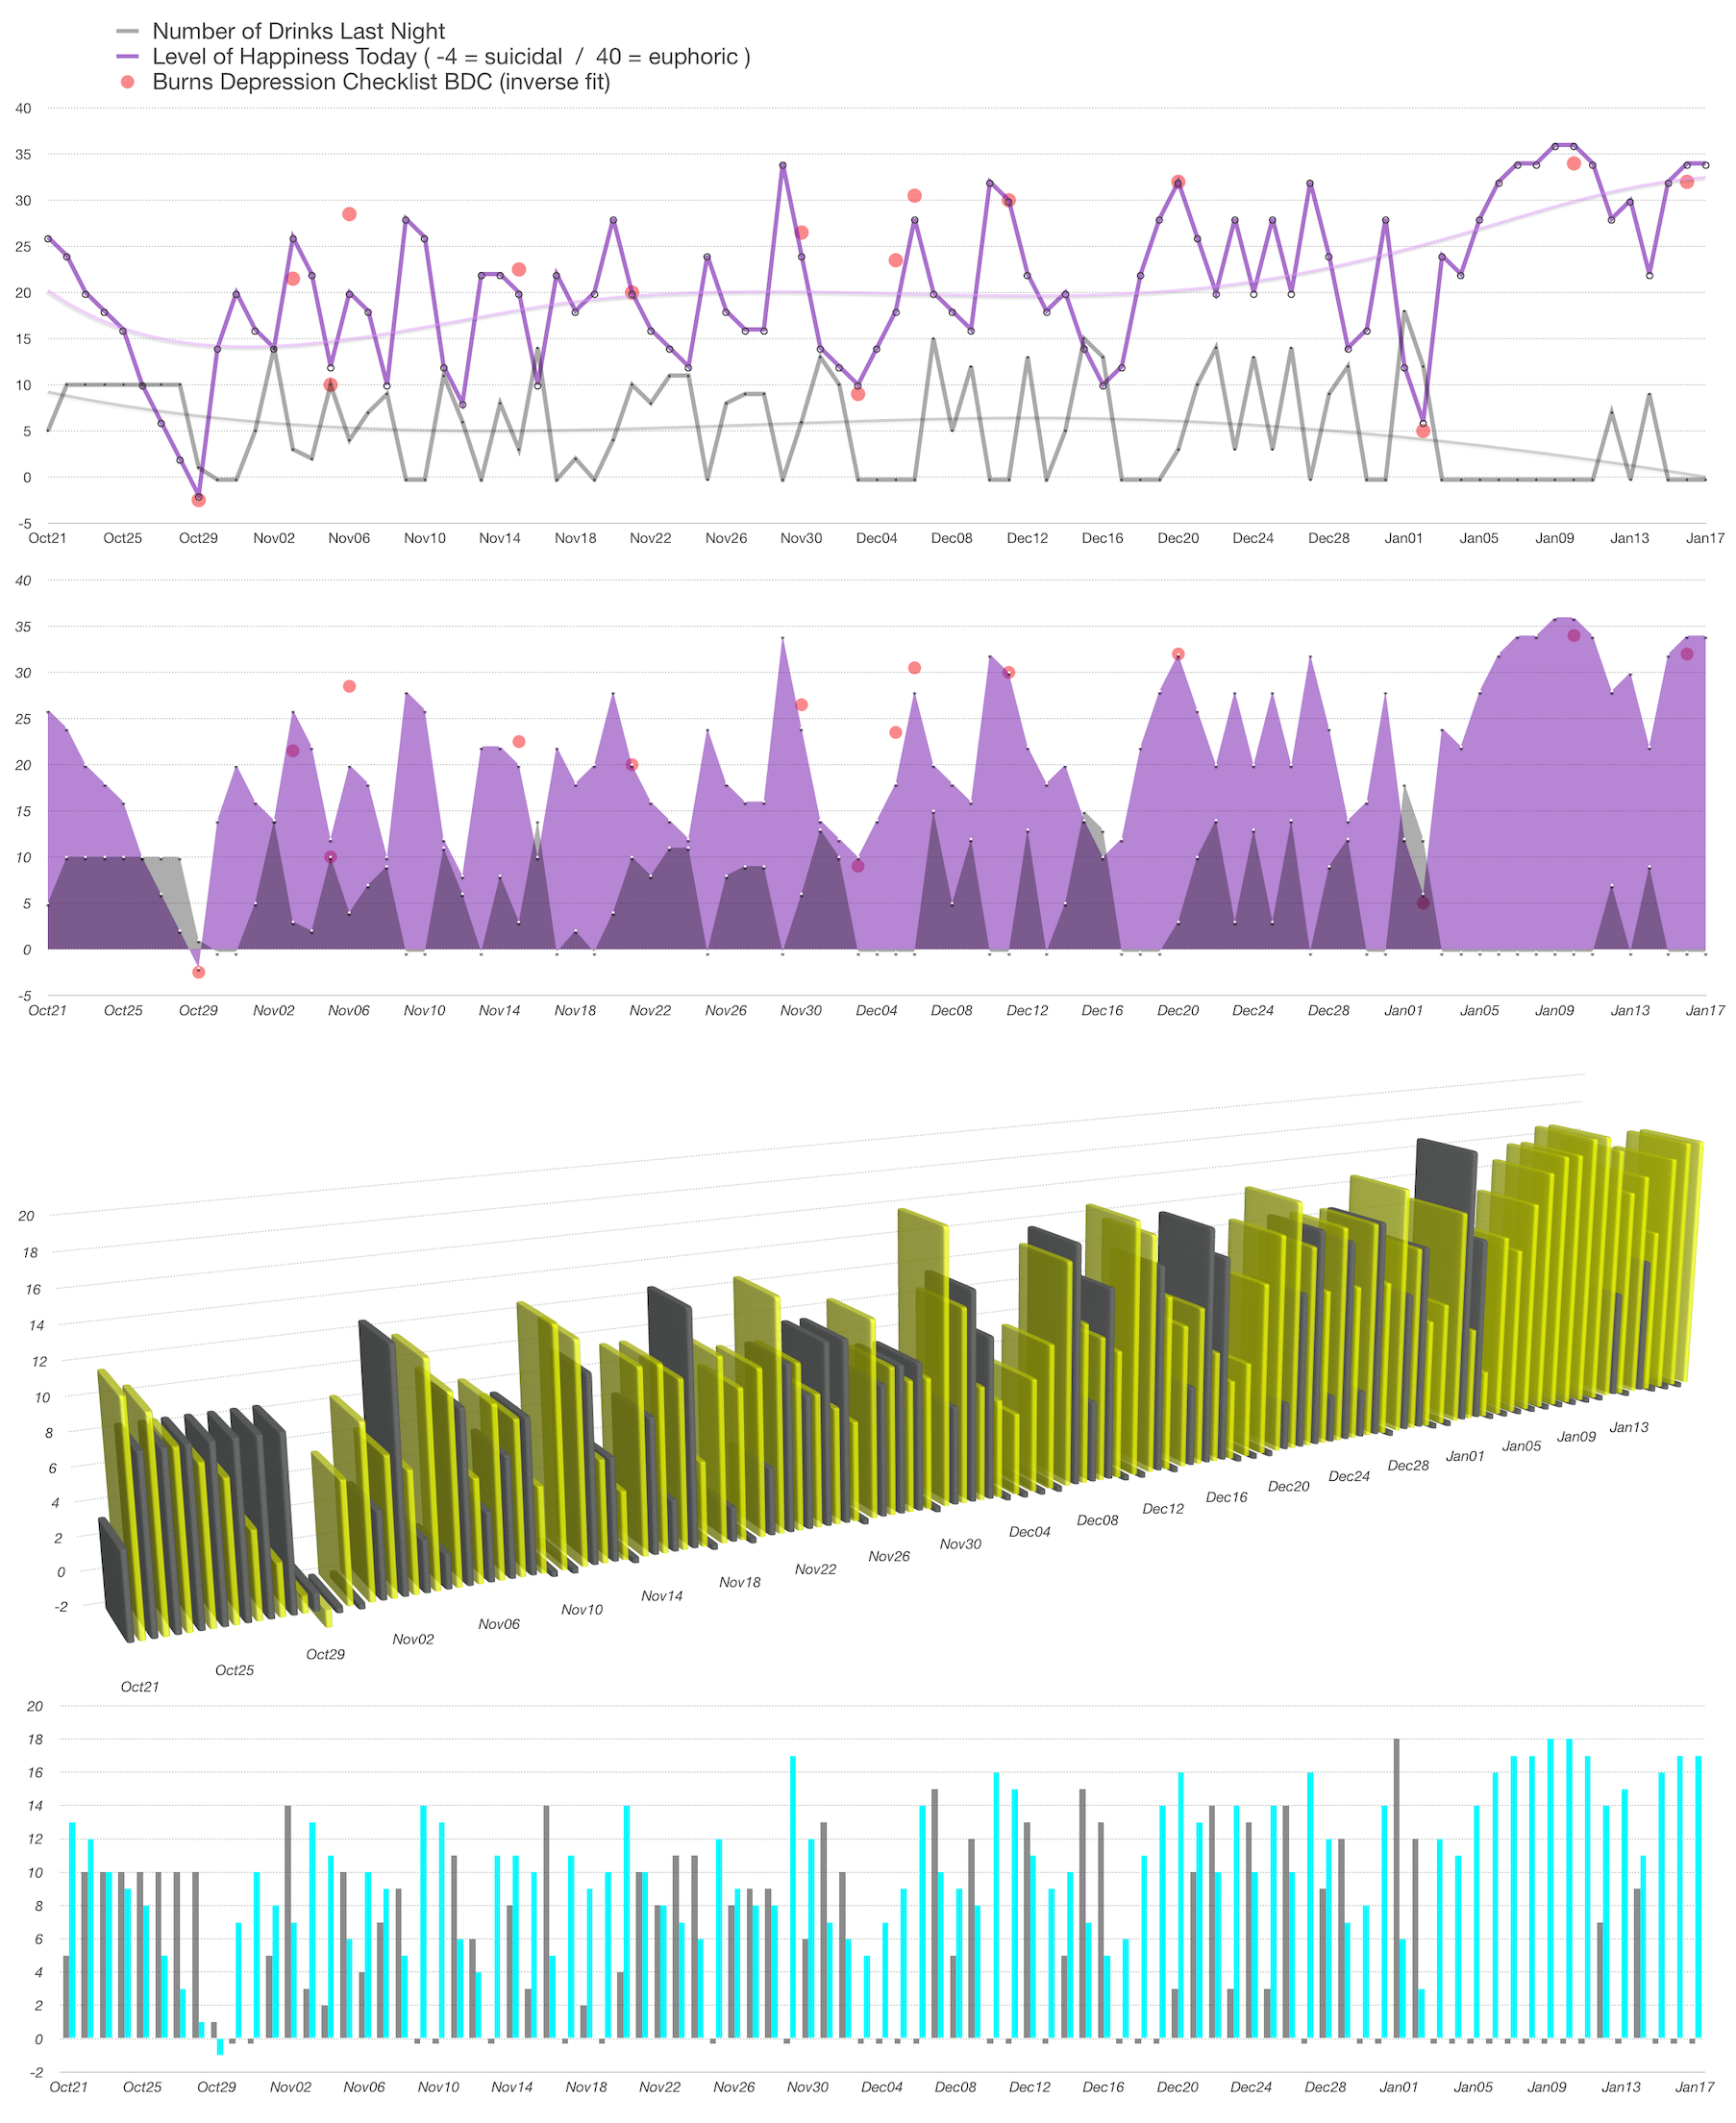
[UPDATE] 3 months of Drinks per Night compared to Level of Happiness [OC]
By onTheUpUp
At infographic.tv we provide handpicked collection of the best infographics and data charts from around the world.