Video Infographic : Episode 12: Data Merge Infographics with Chartwell
Video
Description
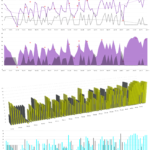
This episode demonstrates how to create infographics using the chartwell bars font.
Since 2011, the chartwell typeface has provided the ability to make various graphs for not just Adobe InDesign, but any application that can display its opentype properties. I have found that the typeface is not limited to graphs using the font alone, and can be used to make a graphic move within X and Y coordinates, and to manipulate graphics to make them behave as an infographic. This video demonstrates several methods that can easily be tweaked and improved upon.
Links mentioned in the video:
Chartwell Bars
InDesignSecrets article to make chartwell change the size of a shape
Australian alcohol consumption data from the Australian Bureau of Statistics:
Declaration: I have NOT been paid to promote the Chartwell typeface or the fontfont foundry, or Adobe InDesign or any of its products in this video.